

Seeking clarity
Where to next? Try to mute the noise.
It seems like the modern world is purposely designed to drown us in confusion. Endless social media feeds pour fuel on the fire of our political polarization, and drown us in a cacophony of propaganda designed to engage (and enrage). We don’t just have different opinions from our neighbours, we are fed different information which we perceive as facts.
A consequence of this is that we see the world through red or blue tinted glasses, and have largely become completely incapable of adjusting to the brightness of unfiltered light (otherwise known as the truth).
The future reveals the truth
In investing, “truth” is only known in hindsight. Yes, the stock market was expensive in 1996 (the year Alan Greenspan famously accused equity investors of “irrational exuberance”). It remained expensive in 1997 while huge IPOs like Amazon and Netflix held investors enthralled by the promise of instant riches. The first big test for the bubble was the LTCM hedge fund blowup in ‘98, but that proved to be just a temporary blip. The year was 1999 when Warren Buffett wrote a Fortune magazine article arguing that investors were expecting far too much from stocks. And yet, the market marched on. The only “truth” is what the market is doing this very moment.
It was only in March of 2000 that things finally started to collapse under their own weight. There was no specific trigger, only an increasing awareness that prices were too high, that began to spread like wildfire. Barron’s took it mainstream with an article highlighting the number of high-flying stocks dangerously close to burning through their cash balances in the next 12 months.
Where are we now?
We don’t know when the current market rally will end. It doesn’t have to be any particular piece of news or events; rather, it can just happen as the weight of high expectations increases with every new high. The flood of huge upcoming IPOs could be just the trigger that sucks up enough capital to leave the rest of the market’s high flyers vulnerable to an air pocket.
In the meantime, when I’m looking for clarity, I try to simplify things as much as possible. I’m not a chartist, but I do like to see what the charts are saying from time to time as a reflection of the underlying market psychology. Helpfully, relying on the price movement allows you to tune out the day to day barrage of news headlines driven by the whims of the President’s Twitter-fingers.
One of my favourite indicators is to compare the percentage of stocks trading below their 200 day moving average to the broader market. I like this because if you were paying attention to it back in 2007, it very clearly telegraphed the underlying weakness in the market (and the economy) that would lead to the “great recession” of ‘08-09.
As illustrated in the following chart (the S&P 500 through ‘06-’07 is the top panel, and the percentage above the 200 day moving average in the bottom panel).
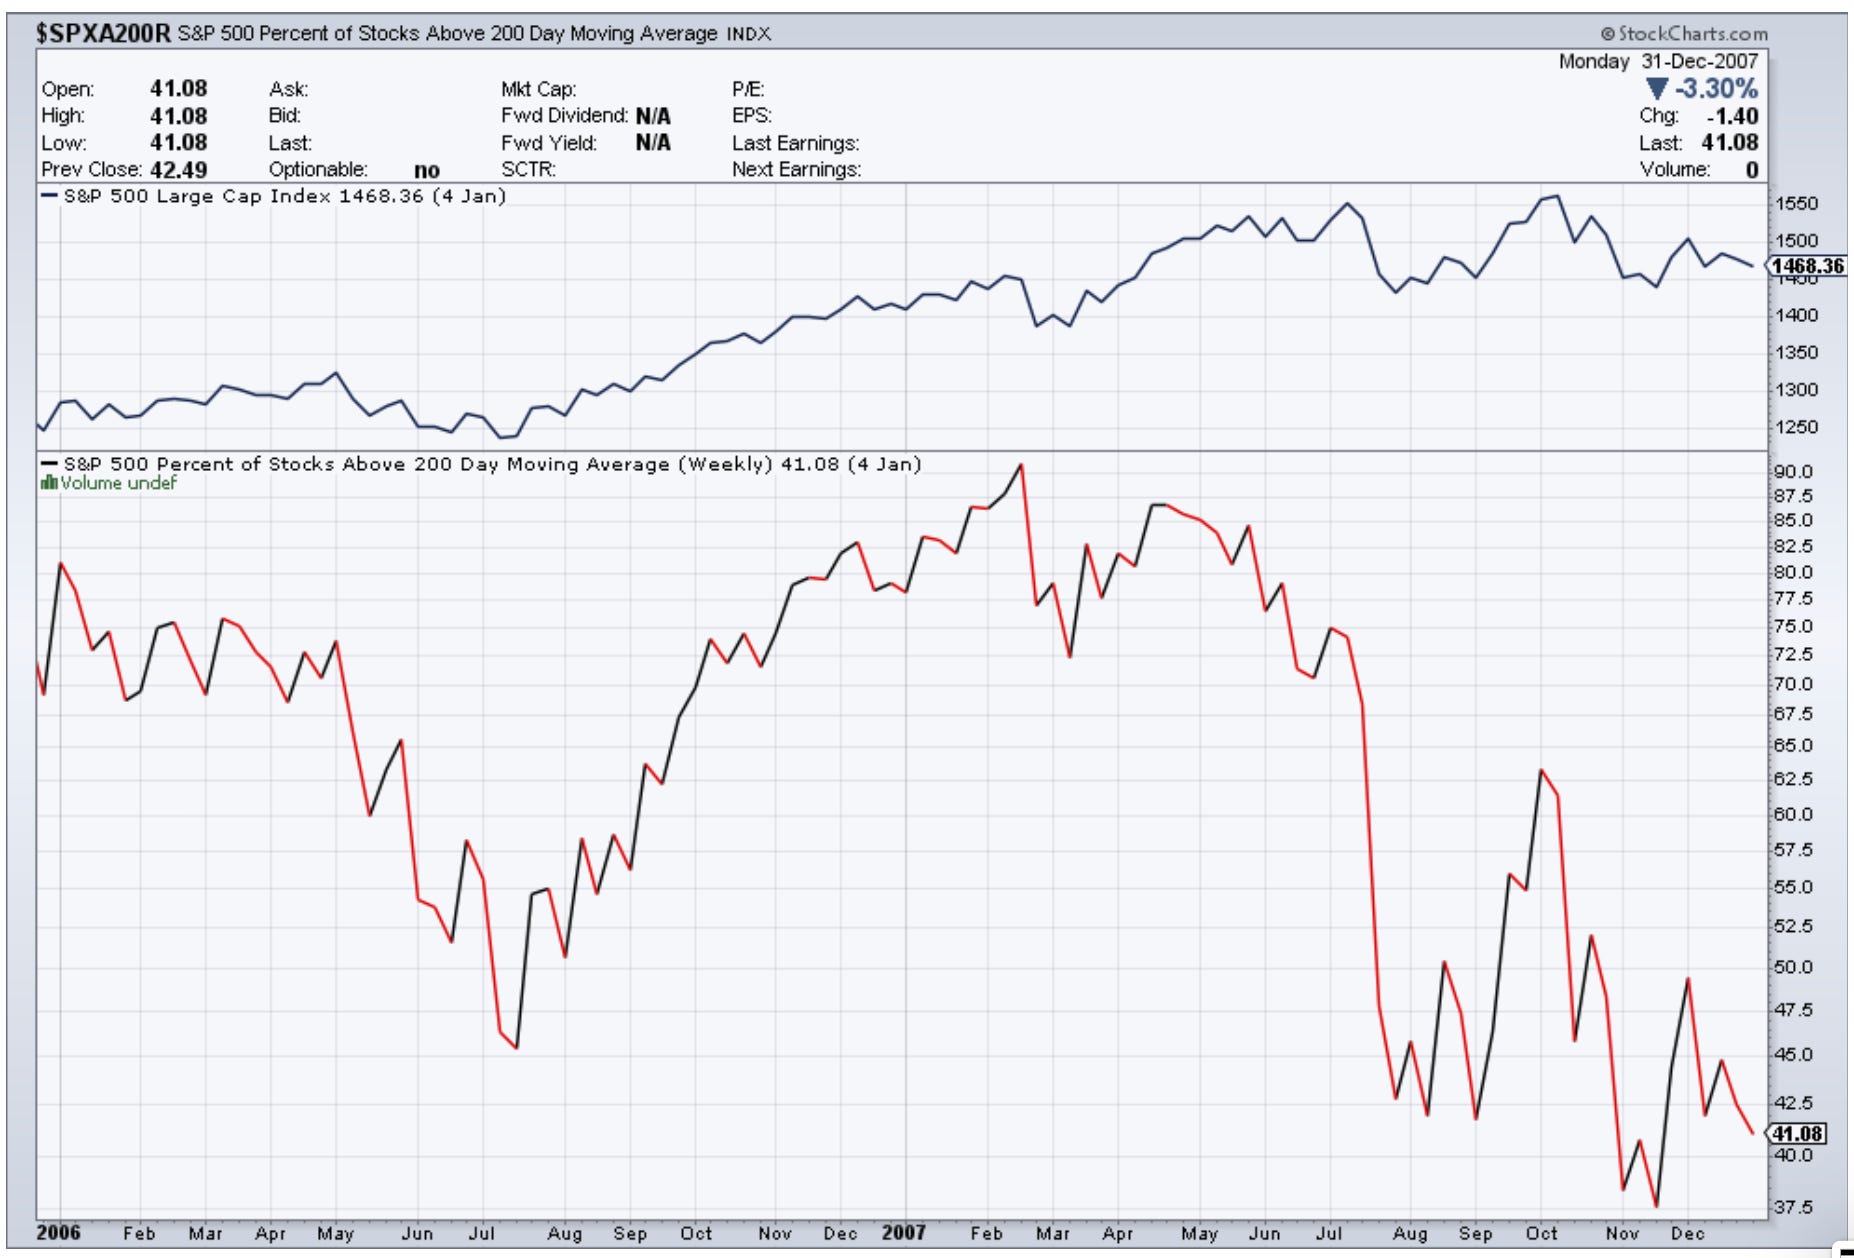
Crazy how you can see the pattern of a market trying to push through the highs 3x in late 2007, while the percentage of stocks below the 200 day moving average collapsed.
This, of course, was the precursor to a violent market crash.
Now if you listen to the hysteria today about the narrow market leadership, you’d probably think we are headed down that same road.
Are we? It’s a good news/bad news story.
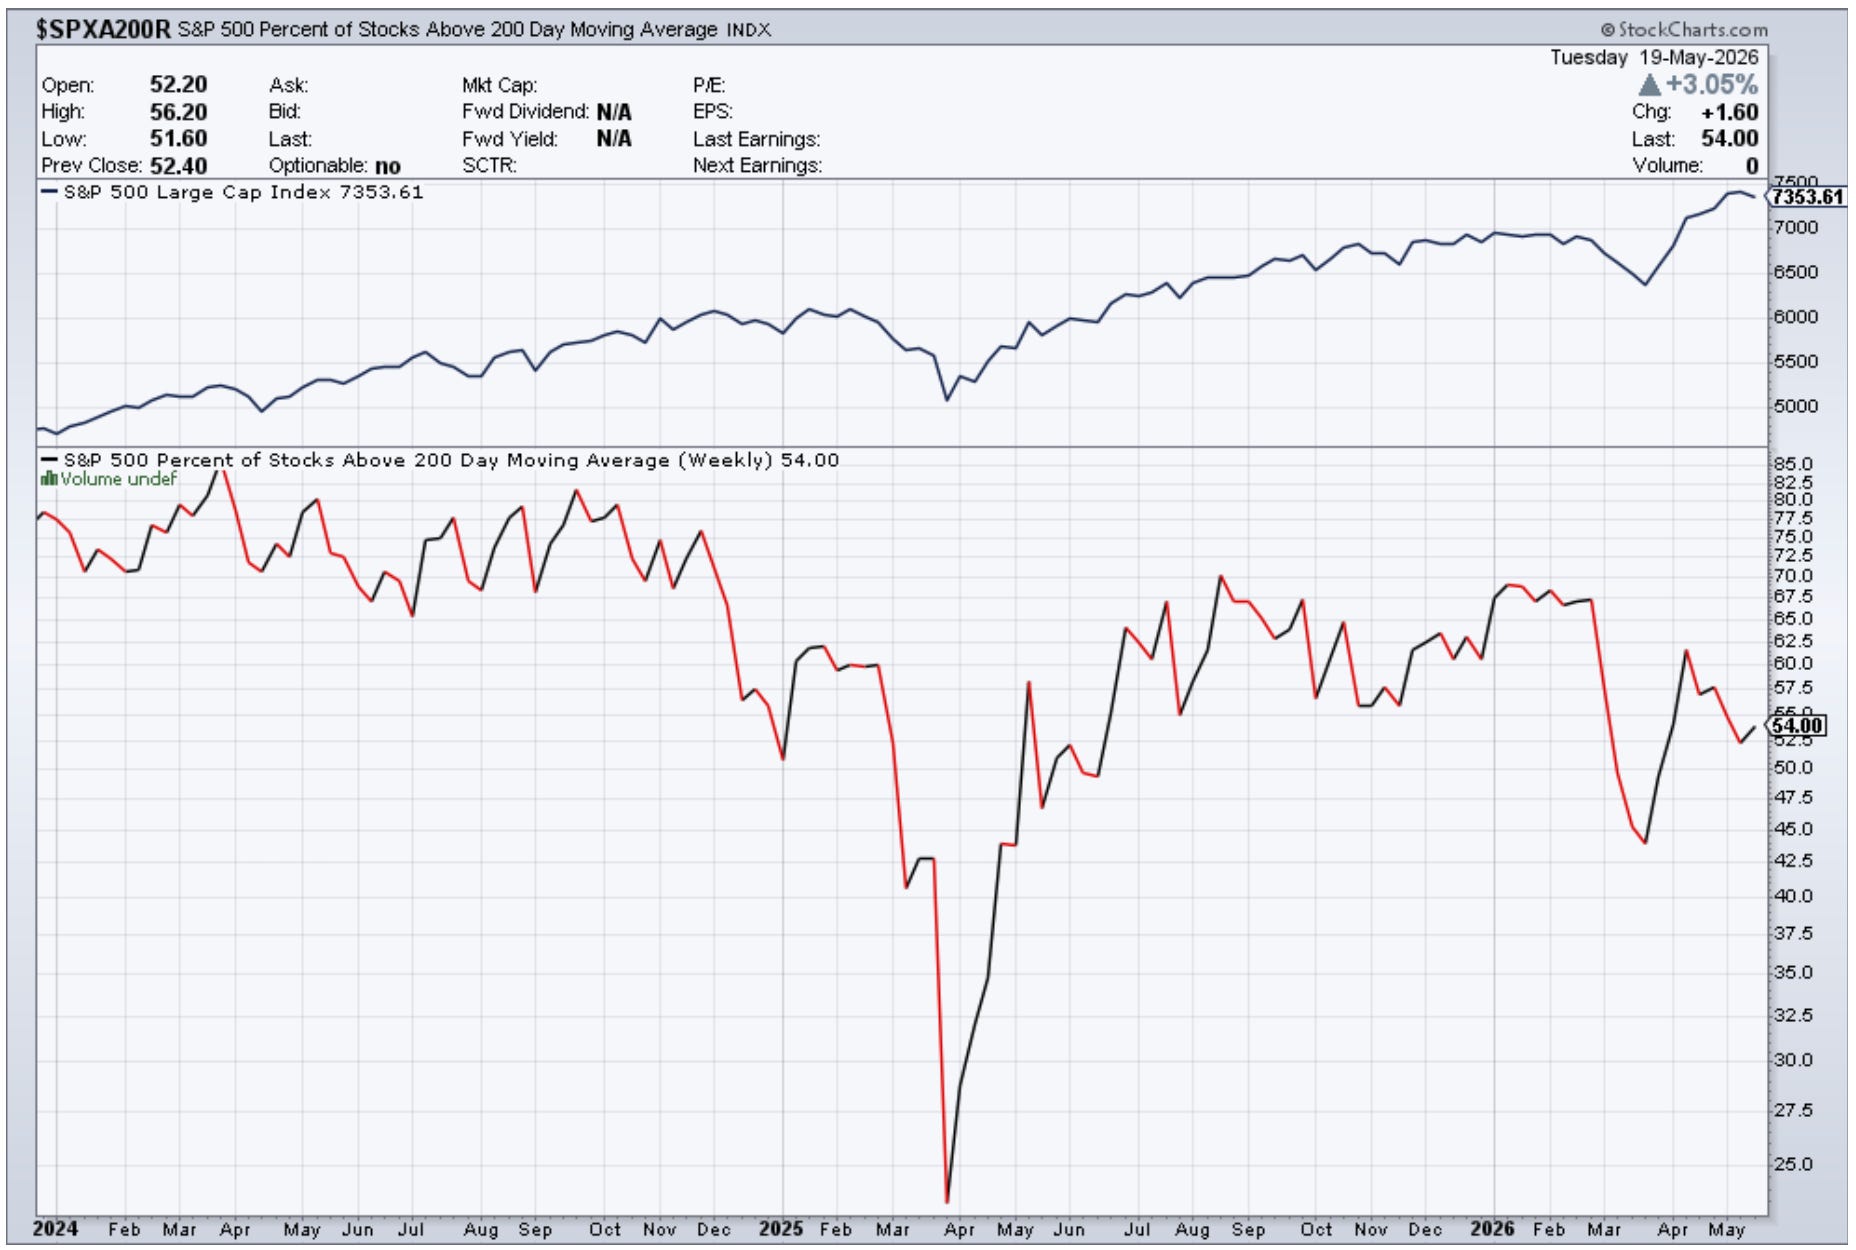
Clearly, it doesn’t look nearly as bad as the pre-’08 crash setup. But this is undoubtedly a market that is seeing declining participation. The number of stocks above the 200 DMA is clearly trending down while the market average continues to rise. It’s not a red light, but it’s certainly at risk of turning yellow, and it wouldn’t take much of a selloff to drive that lower line down to the same levels it was at in late 2007.
Shuffle
Another good way to seek clarity is to take some time to ponder with a pipe. I really do recommend it.